Gene Expression Analysis based on OAR scores
Source:vignettes/Gene_expression.Rmd
Gene_expression.RmdOverview
In this vignette we will explore what genes are associated with increased OAR scores. We will use our toy plasmacytoid dendritic cell dataset that you can download from our github repository.
1. Calculating OAR scores
We can calculate OAR scores with a single line of code. We recommend
you follow the introductory tutorials for a full description of this
function. The result is a Seurat object with OARscore,
KW.pvalue, KW.BH.pvalue and
sparsity values in the meta.data slot.
library(Seurat)
#> Loading required package: SeuratObject
#> Loading required package: sp
#> 'SeuratObject' was built under R 4.5.0 but the current version is
#> 4.5.3; it is recomended that you reinstall 'SeuratObject' as the ABI
#> for R may have changed
#>
#> Attaching package: 'SeuratObject'
#> The following objects are masked from 'package:base':
#>
#>     intersect, t
sc.data <- oar(data = readRDS(file = "pdcs.rds"),
               seurat_v5 = T, count.filter = 1,
               blacklisted.genes = NULL, suffix = "",
               cores = 1)
#> Warning in oar(data = readRDS(file = "pdcs.rds"), seurat_v5 = T, count.filter = 1, : Running process in fewer than 2 cores will considerably slow down progress
#> [1] "Extracting data..."
#> [1] "Extracting count tables"
#> [1] "Analysis started on:"
#> [1] "2026-03-26 16:29:03 UTC"
#> [1] "Identifying gene co-expression patterns..."
...
To explore which cells/clusters display transcriptional shifts, we can visualize the results in a UMAP projection.
library(Seurat)
p1 <- FeaturePlot(
  sc.data, features = "OARscore", order = T, pt.size = 0.5,
  min.cutoff = "q40", max.cutoff = "q90")
p1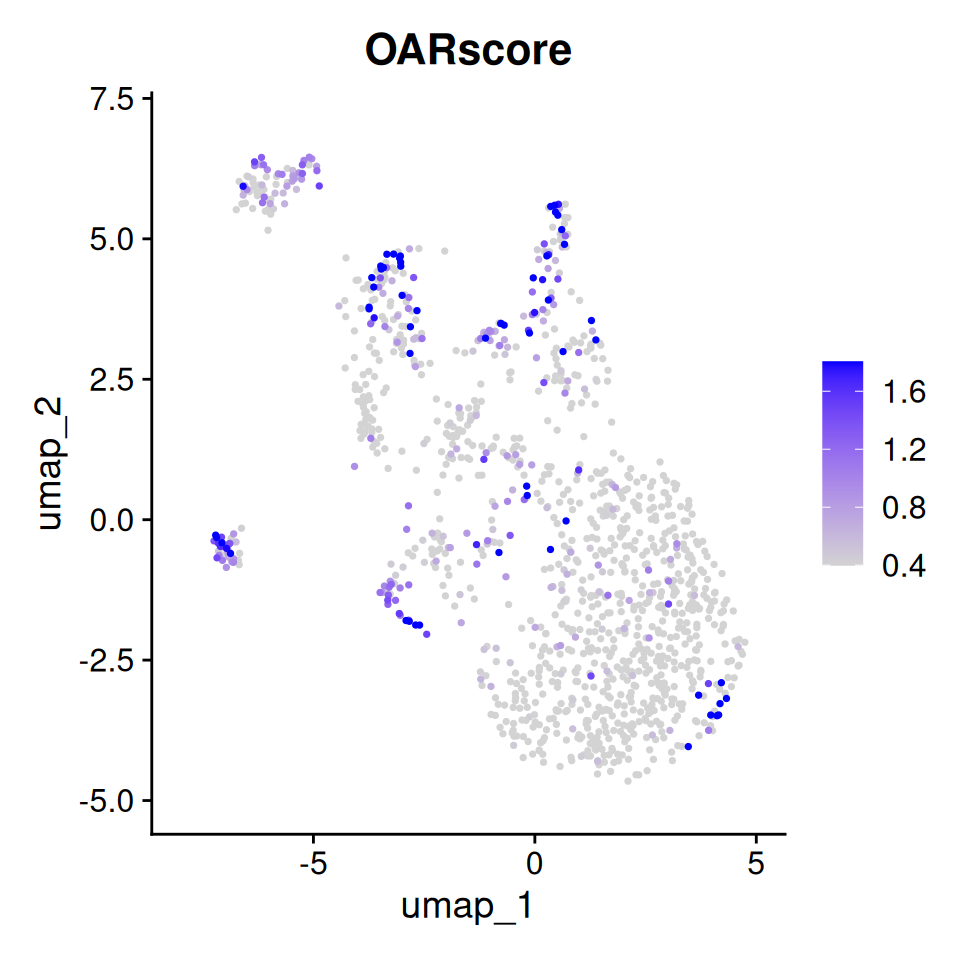
Feature plot of OAR score
Notice that cells with a High OAR score in this dataset cluster together.
2. Identify genes associated with OAR scores
In a typical scRNAseq analysis workflow, differential gene expression
is calculated based on averaged counts across identified clusters.
Although highly informative, this approach fundamentally looses the
single cell resolution achieved through this technology. As an
alternative to using cluster labels to model gene expression, which
invites biases associated with identifying clusters, we propose to model
gene expression based instead on the value of the OAR score. We
implement this approach using glmGamPoi1, which has superior
performance to other differential gene expression methods in terms of
speed and accuracy. Scaling factors are calculated using
scran::calculateSumFactors(), which benefits from parallel
computing.
oar_deg <- oar_deg(
    data = sc.data, seurat_v5 = T, score.name = "OARscore",
    score = NULL, count.filter = 1,
    blacklisted.genes = NULL,
    splines = TRUE, degrees.freedom = 5,
    auto.threshold = TRUE, custom.tr = NULL)
#> [1] "Analysis started on:"
#> [1] "2026-03-26 16:29:10 UTC"
#> [1] "Extracting count tables"
#> [1] "FDR threshold set to:"
#> [1] 1e-12
#> Warning in oar_deg(data = sc.data, seurat_v5 = T, score.name = "OARscore", : Using splines increases calculation time by 3-5x
#> [1] "Analysis completed at:"
#> [1] "2026-03-26 16:30:03 UTC"
A brief explanation of these parameters is presented here:
-
datamay be an raw matrix of counts or a fully processed Seurat object with an OAR score calculated, as indicated by theseurat_v5parameter. The name of the score should be indicated in thescore.nameparameter. -
scoreonly needs to be provided if starting from a count matrix and should be a vector of OAR scores in the same order as the columns of the count matrix. -
count.filtercontrols the minimum percentage of cells expressing any given gene for that gene to be retained in the analysis. Defaults to 1. -
blacklisted.genes, Allows you to provide a vector of uninformative gene names (i.e. non-coding genes) to exclude from the analysis. This analysis automatically excludes all ribosomal genes. Defaults toNULL. -
splinesanddegrees.freedom, control whether splines should be fit based on the OAR score (and how many, as set bydegrees.freedom) to capture non-linear associations between scores and gene expression. We recommend settingsplinestoTRUEanddegrees.freedombetween 3-5. Ifsplinesis set toFALSE, only monotonic/linear associations will be retrieved. -
auto.thresholdandcustom.trcontrol the false discovery rate (FDR) threshold to consider a gene significantly associated with the OAR score.auto.thresholdset toTRUE(recommended) estimates this threshold based on the number of cells tested. Typically, given the high number of observations, p values calculated based on individual cells tend to be highly significant, even where little association is observed between gene expression and the predictive variable. Ifauto.thresholdset toFALSE, then a custom p value threshold should be provided withcustom.tr. Setting this value to typical ranges (i.e. 0.05-0.01) will likely result in spurious associations.
The results of the analysis is a matrix with the regulated and filtered genes:
oar_deg
#>              name         pval     adj_pval f_statistic df1      df2 lfc
#> 1           HSPB1 1.420100e-87 1.655695e-83    98.24009   5 1262.951  NA
#> 2        PPP1R15A 1.884017e-67 1.098288e-63    73.25076   5 1262.951  NA
#> 3         HLA-DRA 1.599269e-61 6.215294e-58    66.22267   5 1262.951  NA
#> 4             UBC 1.854397e-60 5.405103e-57    64.97655   5 1262.951  NA
#> 5        HLA-DRB1 5.356963e-60 1.249137e-56    64.43856   5 1262.951  NA
#> 6        HSP90AB1 3.049325e-56 5.925347e-53    60.08569   5 1262.951  NA
#> 7        HSP90AA1 1.649319e-50 2.747058e-47    53.54926   5 1262.951  NA
#> 8        HLA-DPA1 5.614897e-50 8.183010e-47    52.94923   5 1262.951  NA
#> 9             UBB 2.792879e-49 3.618020e-46    52.16515   5 1262.951  NA
...
For a full description of each column, visit the
glmGamPoi documentation. For our purposes, the
name and adj_pval columns (corresponding to
genes and FDR, respectively) are the most important results.
3. Visualize results
Overall, this analysis identifies 135 genes significantly associated with OAR scores. If we plot the top 9 most significant genes alongside our previously calculated OAR scores, we can observe that we identified several candidates for further analysis:
library(Seurat)
library(patchwork)
library(ggplot2)

p1 <- FeaturePlot(
  sc.data, features = "OARscore", order = T, pt.size = 0.5,
  min.cutoff = "q40", max.cutoff = "q90") +
  labs(title = "OAR score") +
  theme(
      aspect.ratio = 1,
      legend.position = "none",
      axis.title = element_blank(),
      axis.text = element_blank(),
      axis.ticks = element_blank(),
      axis.line = element_blank(),
      plot.title = element_text(size = 8, face = "plain"))

p2 <- FeaturePlot(
  object = sc.data, pt.size = 0.1,
  slot = "counts",
  min.cutoff = "q40", max.cutoff = "q90",
  features = oar_deg$name[1:9], combine = F)

p2 <- lapply(p2, function(x){
  x +
    theme(
      aspect.ratio = 1,
      axis.title = element_blank(),
      axis.text = element_blank(),
      axis.ticks = element_blank(),
      axis.line = element_blank(),
      plot.title = element_text(
        size = 8, face = "italic")
    ) +
    NoLegend()
})

p1|wrap_plots(p2, ncol = 3)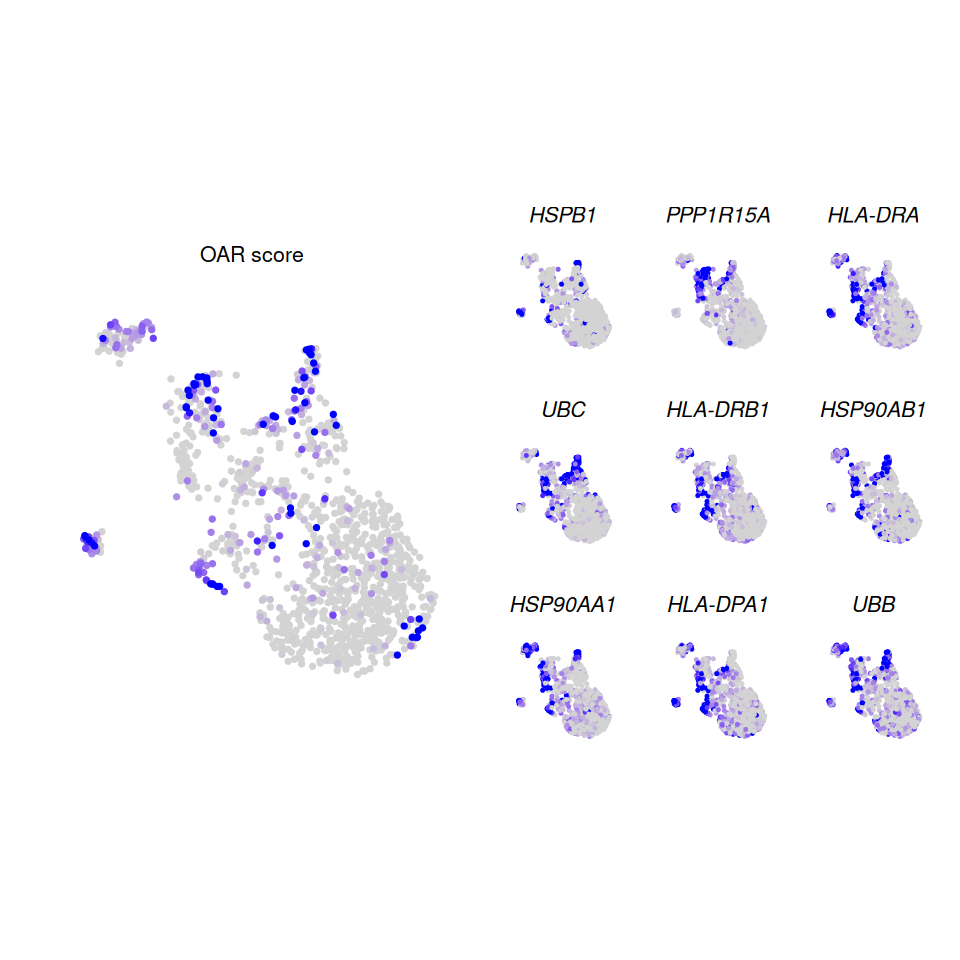
Genes associated with OAR score
Here we can see several features associated with high OAR scoring cells (i.e. PPP1R15A, HSPB1, EIF1, UBC, NMI, DNAJC7, PMAIP1, SAR1A) as well as one (B2M) which is associated with low OAR scoring cells.